1Migrated from folder: AsanaTests/api
30```
31
32Finally, you may be wondering why I queue up feedback in `@stevekrouse.docsFeedback`, a private JSON val, and then process it via [`@stevekrouse.formFeedbackAlert`](https://www.val.town/v/stevekrouse.formFeedbackAlert) instead of sending it along to Discord directly in this val. I [tried that originally](https://www.val.town/v/stevekrouse.docFeedbackForm?v=61) but it felt too slow to wait for the API call to Discord before returning the "Thanks for your feedback" message. This is where the `context.waitUntil` method (that Cloudflare workers and Vercel Edge Functions support) would really come in handy – those allow you to return a Response, and then continue to compute. Currently Val Town requires you to stop all compute with the returning of your Response, so the only way to compute afterwards is to queue it up for another val to take over, and that's what I'm doing here.
33
34
3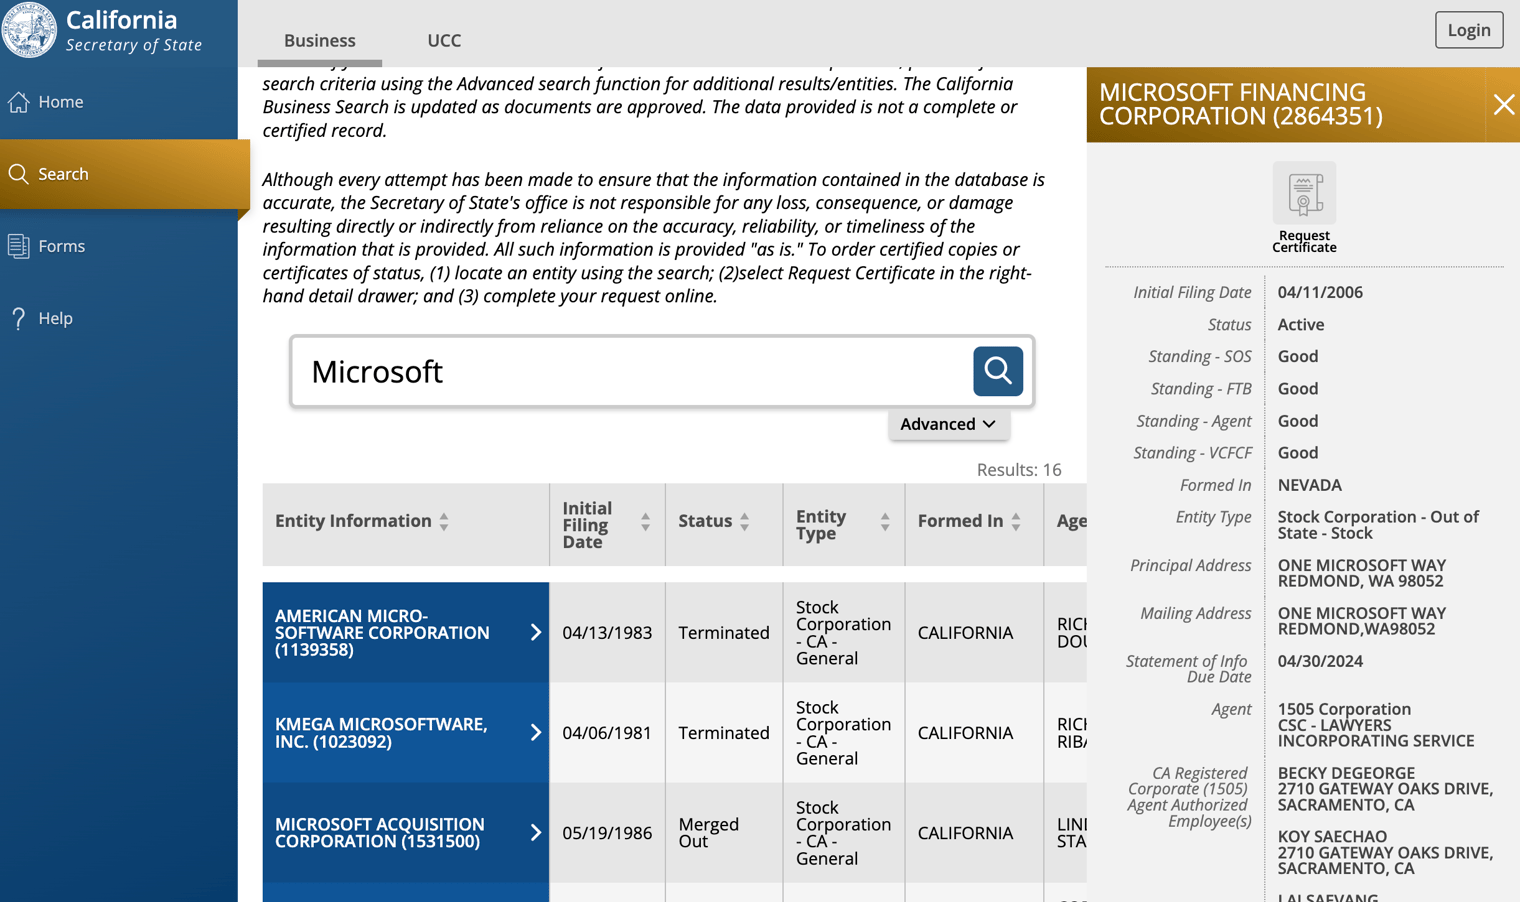
4
5There's nothing I like more than a little open data and transparency! This Val shows you how to use the [California Secretary of State Business Search](https://bizfileonline.sos.ca.gov/search/business) as a faux-API and get notifications when records change. This lets you know when a business updates their records, changes their good-standing status, and so on.
6
7Here's how to use it:
135. Now, in the network tab of your developer tools, you should see a request that ends with `false`. You'll find a number in that URL. Plug that number into the val at the spot at the top.
14
15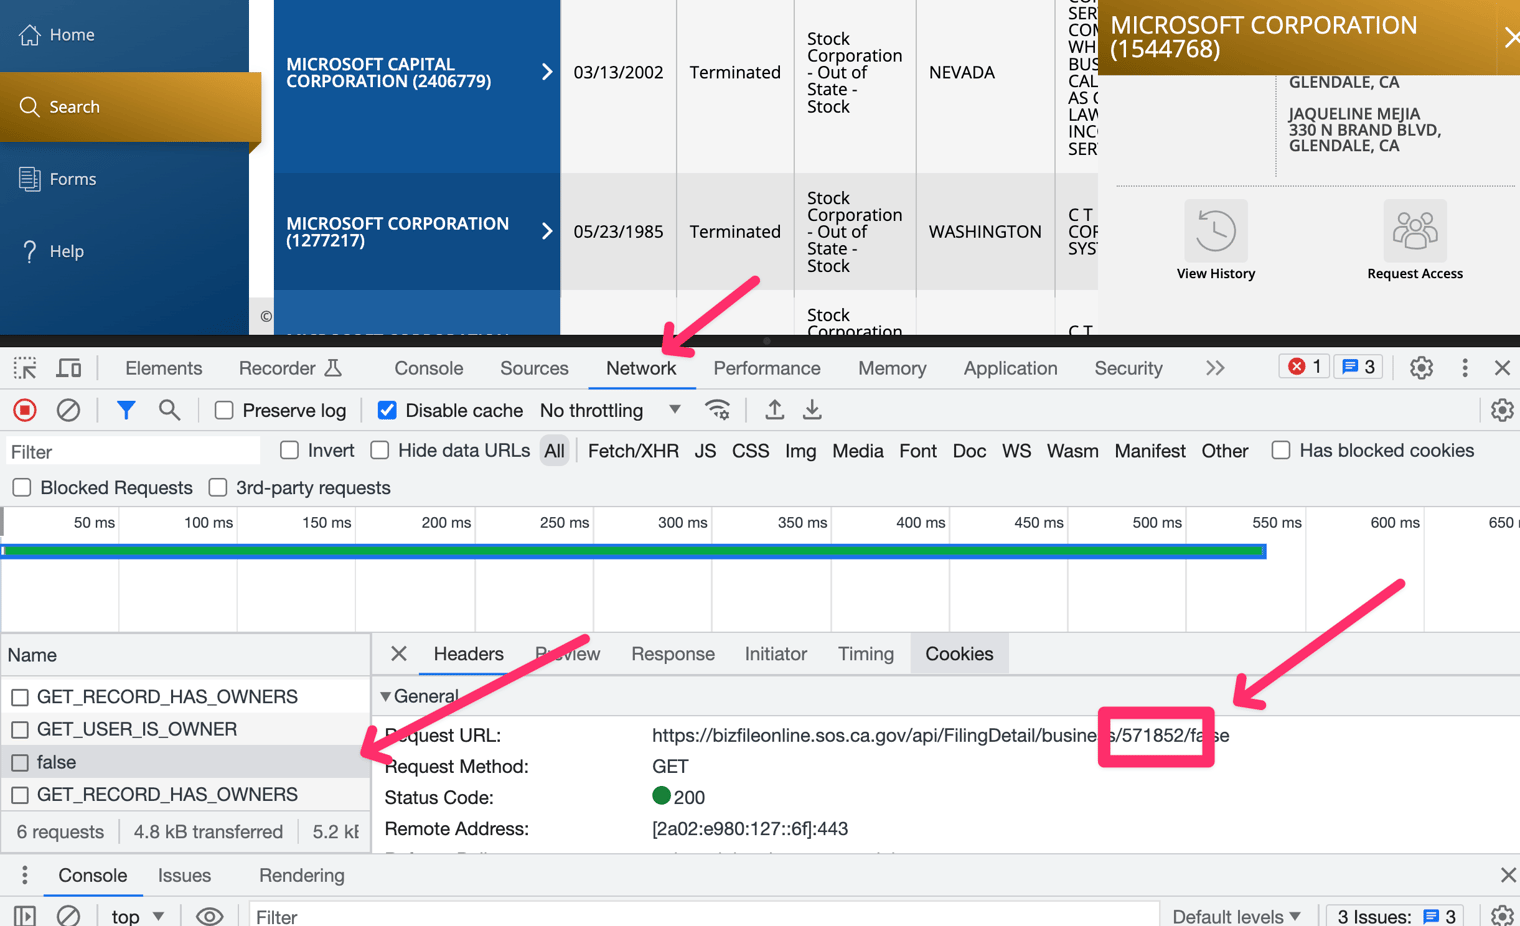
16
17(We're almost there!)
27### Notes
28
29- [opencorporates](https://opencorporates.com/) has a _way_ better system for open data around businesses, but to get a free API key you need to be a nonprofit or a registered journalist, and I am neither. But if you are, use that!
30- Thanks to America's laws around business registration, it's commonplace for businesses to mask their control and ownership by using registration agents and a few layers of corporate structure.
2## SSR chart with Observable Plot
3
4This chart is rendered server-side by val.town, using Observable Plot, from data loaded from the GitHub API. For a more complete example, see https://www.val.town/v/fil.earthquakes. For information on this chart, see https://observablehq.com/@observablehq/plot-barley-trellis.
5
6
1Migrated from folder: docs/api/userValsExample
1Migrated from folder: docs/api/userVals
1Migrated from folder: docs/api/userExample
1Migrated from folder: docs/api/user
1Migrated from folder: docs/api/valRunsExample
1Migrated from folder: docs/api/valRuns